Drivers for Stock Indexes (Indices)

Stock indexes such as the S&P 500, Dow Jones Industrial Average, and Nasdaq Composite serve as key barometers of U.S. large-cap equity market performance.
Stock Indexes: Potential Drivers for Higher or Lower Moves in the Coming Months
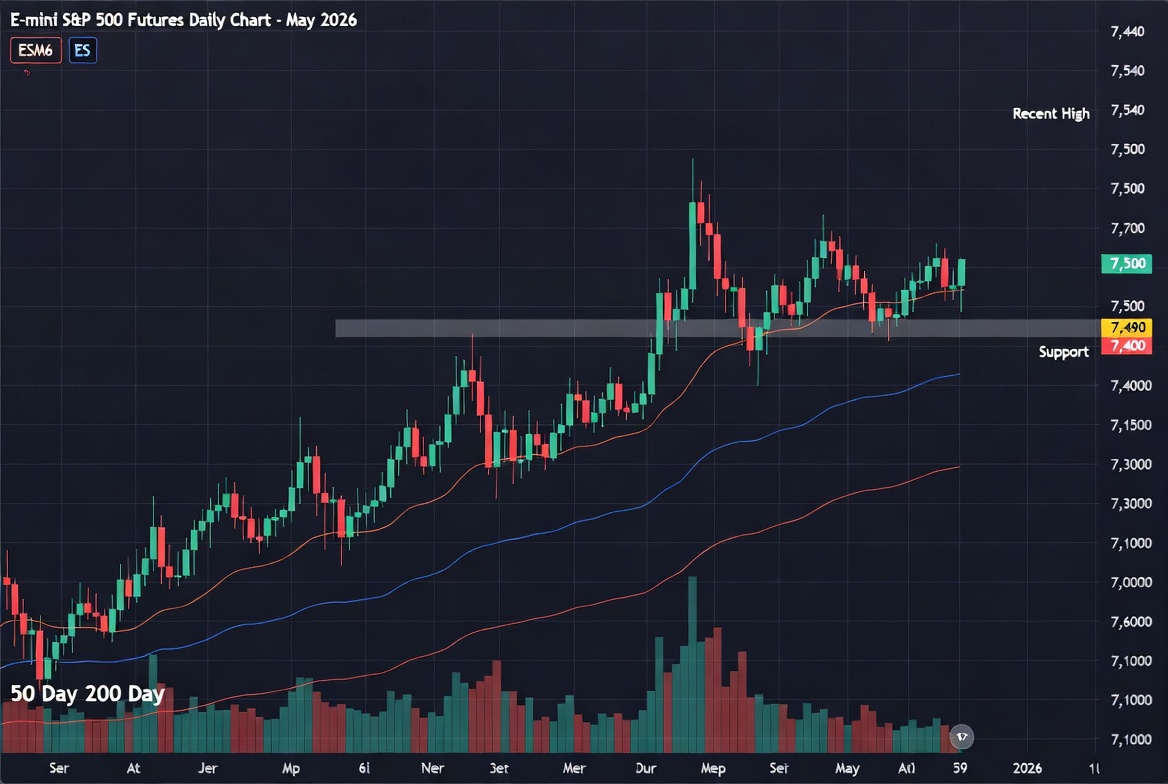
Stock indexes such as the S&P 500, Dow Jones Industrial Average, and Nasdaq Composite serve as key barometers of U.S. large-cap equity market performance. As of late May 2026, these indexes have been trading near record highs, with the S&P 500 recently around the 7,400–7,473 level following strong performance in prior periods.
Market participants often analyze a combination of fundamental economic factors, corporate earnings trends, and technical price patterns when considering potential future movements. It is important to note that past performance is not indicative of future results, and stock indexes can experience significant volatility. This discussion is for educational and informational purposes only and does not constitute investment advice, a recommendation to buy or sell any security, or a prediction of specific price levels.
Factors That Could Contribute to Higher Index Levels
Several elements may support continued strength in stock indexes over the coming months. Corporate earnings growth remains a primary driver. Many analysts highlight expectations for solid or double-digit earnings per share (EPS) expansion in 2026, fueled in part by ongoing investments in artificial intelligence (AI) technologies, efficiency gains, and broader adoption across sectors.
Monetary policy also plays a role. Markets have observed Federal Reserve actions in recent periods, with potential for further adjustments depending on inflation and labor market data. Lower interest rates, if realized, could reduce borrowing costs for companies and make equities more attractive relative to fixed-income alternatives.
Resilient consumer spending and business investment have helped the U.S. economy navigate challenges. Continued AI-related capital expenditures and innovation could broaden participation beyond a handful of large technology names, potentially supporting broader index gains. Some outlooks suggest U.S. equities may outperform global peers in this environment, though outcomes depend on many variables.
Global growth, even if uneven, and accommodative policies in certain regions could provide additional tailwinds.
Factors That Could Contribute to Lower Index Levels or Increased Volatility
Conversely, several risks could pressure stock indexes downward or increase short-term volatility. Geopolitical developments, particularly the ongoing situation involving Iran and its impact on global energy supplies, have elevated oil and input costs. Higher energy prices can contribute to inflationary pressures, potentially complicating central bank policy and squeezing corporate margins or consumer spending.
Valuations for major indexes remain elevated by historical standards. High price-to-earnings multiples leave limited room for error if earnings disappoint or if economic growth slows more than expected. Sticky inflation, if it resurfaces, could delay rate cuts or prompt tighter policy, historically weighing on risk assets.
Labor market dynamics, policy uncertainties (including tariffs or fiscal measures), and potential slowdowns in key economic indicators like manufacturing or services PMI could also act as headwinds. Broader market rotation, where leadership shifts away from high-performing sectors, has been observed and may continue, leading to periods of consolidation or pullbacks.
Technical Analysis Considerations
From a technical perspective, major indexes have shown bullish characteristics in recent analysis. The S&P 500 has broken upward from prior consolidation ranges, with no immediate overhead resistance noted in some chart reviews. Moving averages (such as the 50-day and 200-day) have generally aligned in a supportive manner, with shorter-term averages above longer-term ones indicating positive momentum.
Relative Strength Index (RSI) and other oscillators can provide additional context—readings that avoid extreme overbought levels might suggest room for further upside, while negative divergences could signal caution for potential near-term reactions. Support levels, such as around prior all-time highs or key moving averages (e.g., near 7,000 or 6,900–7,000 zones in some analyses), may act as areas of interest if pullbacks occur.
Volume trends, candlestick patterns, and broader market breadth (e.g., advance-decline lines) are also monitored by chartists. A sustained hold above key breakout levels could reinforce bullish structures, while breaks below support might open the door to deeper corrections. These patterns should be viewed alongside fundamentals, as technical signals can change rapidly with new information.
It is worth noting that technical analysis is subjective and does not guarantee outcomes. Markets can remain overbought or oversold for extended periods.
Outlook and Key Considerations
In summary, stock indexes could see further upside in the coming months if earnings growth remains robust, AI themes expand, and policy support materializes amid a resilient economy. However, risks from energy prices, inflation, high valuations, and geopolitics could lead to periods of weakness or heightened volatility. A "wall of worry" environment has historically allowed markets to climb, but corrections are a normal part of market cycles.
Investors might consider diversification, risk management, and alignment with their individual time horizons and objectives. Monitoring upcoming economic data releases, earnings reports, and central bank communications will be important.
This article was generated with the assistance of artificial intelligence (AI). While the information presented is believed to be reliable and based on available data at the time of creation, no guarantees are made regarding its accuracy, completeness, or timeliness.
All articles written are strictly proofread by a human, and for compliance purposes.
AI systems can occasionally produce errors, omissions, or outdated information. All data, statistics, market levels, and analyses should be independently verified by the reader through official sources.
This content is provided for educational and informational purposes only and does not constitute investment advice, financial recommendations, or a solicitation to buy or sell any security or futures contract.
Always conduct your own due diligence and consult with qualified professionals before acting on any information contained herein.