Natural Gas Fundamentals

Natural gas, traded primarily at the Henry Hub benchmark in Louisiana, plays a critical role in U.S. energy markets for heating, power generation, and exports.
Natural Gas Fundamentals: Henry Hub Storage, LNG Export Capacity, and Seasonal Weather Impacts
Natural gas, traded primarily at the Henry Hub benchmark in Louisiana, plays a critical role in U.S. energy markets for heating, power generation, and exports. As of late May 2026, Henry Hub spot prices are hovering around $3.00–$3.10 per MMBtu, with futures reflecting moderate volatility. This analysis examines key supply and demand drivers: underground storage levels, LNG export infrastructure growth, and seasonal weather patterns.
Important note: This article is for educational and informational purposes only. It does not constitute investment advice, a recommendation to buy or sell futures contracts, or a forecast of specific price movements. Trading natural gas futures involves substantial risk of loss and is not suitable for all investors. Past performance is not indicative of future results.
Henry Hub Storage Levels
U.S. natural gas storage provides a vital buffer against seasonal demand swings. According to the latest EIA Weekly Natural Gas Storage Report for the week ending May 15, 2026, working gas in underground storage stood at 2,391 billion cubic feet (Bcf). This reflected a strong injection of 101 Bcf, putting inventories 33 Bcf above the same period last year and 149 Bcf above the five-year average of 2,242 Bcf.
Inventories are currently within the five-year historical range and entering the injection season (typically April–October) in relatively healthy condition. Analysts project that storage could end the injection season on October 31 at around 7% above the five-year average, assuming normal weather and steady production.
Strong storage levels generally exert downward pressure on prices by reducing the risk of winter shortages. However, if injections slow significantly due to higher demand or production issues, the surplus could erode, supporting prices later in the year. Year-over-year comparisons and regional breakdowns (East, Midwest, South Central, etc.) are closely monitored, as imbalances in key areas can create localized tightness.
LNG Export Terminal Capacity and Utilization
LNG exports have become a major structural driver of U.S. natural gas demand. Current U.S. LNG export capacity stands near 18.3 Bcf/d, with high utilization rates at major terminals. New projects are expanding this footprint significantly.
In 2026, additions such as Corpus Christi Stage 3 (additional trains), Golden Pass LNG (initial trains), and contributions from Plaquemines LNG are expected to boost capacity. Further growth is anticipated into 2027, potentially pushing total U.S. LNG export capability above 22 Bcf/d by the end of the decade.
LNG feedgas demand has been robust, often exceeding 15–19 Bcf/d in peak periods, as global buyers seek reliable supplies amid international disruptions. Higher LNG outflows pull gas from the domestic market, supporting Henry Hub prices over time. However, maintenance schedules, shipping constraints, and global competition can cause short-term fluctuations in export volumes.
This export growth represents one of the fastest-growing components of U.S. natural gas demand, shifting the market balance from being primarily domestic-focused to increasingly integrated with global pricing dynamics.
Seasonal Weather Impacts
Weather remains one of the most unpredictable yet influential factors for natural gas prices.
Summer (Injection Season): Hotter-than-normal temperatures increase power generation demand for air conditioning, particularly in the South and Southwest, boosting gas-fired electricity output. A strong hurricane season or persistent heat waves could slow storage injections by diverting gas to power plants. Conversely, mild summer weather allows faster injections, potentially building an even larger surplus heading into winter. NOAA’s outlook for the 2026 Atlantic hurricane season suggests below-normal activity due to emerging El Niño conditions, which could limit major disruptions but still warrants monitoring.
Winter (Withdrawal Season): Cold snaps drive heating demand, leading to rapid storage withdrawals. Extreme events, such as the notable Winter Storm Fern earlier in 2026, demonstrated how prolonged freezes can spike prices temporarily. Forecasts for the upcoming winter will be critical—colder-than-average conditions could tighten balances significantly if storage ends the injection season only modestly above average.
Shoulder seasons (spring and fall) typically see transitional demand, but anomalies like unseasonal heat or cold can create volatility.
Combined Outlook
The interplay of these factors creates a nuanced picture for natural gas. Healthy storage levels provide a cushion, but expanding LNG export capacity acts as a steady demand sink that could tighten fundamentals over the medium term. Weather acts as the wildcard: a hot summer followed by a cold winter could accelerate the drawdown of inventories, while consistently mild conditions might keep the market well-supplied.
Production growth remains strong, with U.S. dry gas output projected to set new records, helping meet both domestic and export needs. However, the pace of demand growth—particularly from LNG—may eventually outstrip supply additions, potentially supporting higher prices in 2027 according to some outlooks.
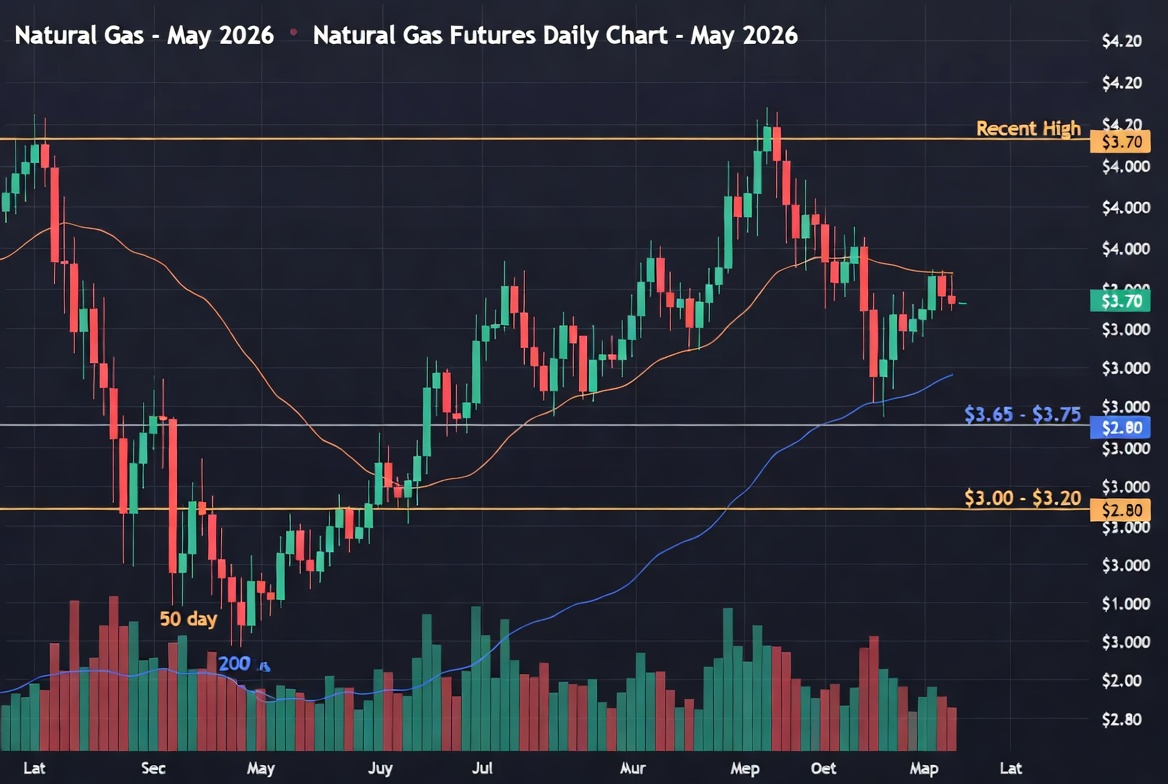
Market participants typically track EIA storage reports (released on Thursdays), weather models, LNG flow data, and production statistics. Technical factors on the futures chart, combined with these fundamentals, help inform trading decisions.
In summary, while current storage provides comfort, the structural tailwind from LNG exports and the ever-present influence of weather suggest that natural gas markets will likely remain dynamic. Investors should maintain disciplined risk management and stay informed on evolving fundamentals.
Important Disclaimer: Investing and trading in futures and commodities involves substantial risk of loss and is not suitable for everyone. The value of investments can decline as well as rise. This article is not personalized advice and does not take into account your financial situation, goals, or risk tolerance. Consult with a qualified financial advisor before making any investment decisions. Past performance does not guarantee future results.
CFTC/NFA Disclaimer: Hypothetical or simulated performance results have certain inherent limitations. Unlike actual performance records, simulated results do not represent actual trading.
This article was generated with the assistance of artificial intelligence (AI). While the information presented is believed to be reliable and based on available data at the time of creation, no guarantees are made regarding its accuracy, completeness, or timeliness.
All articles written are strictly proofread by a human, and for compliance purposes.
AI systems can occasionally produce errors, omissions, or outdated information. All data, statistics, market levels, and analyses should be independently verified by the reader through official sources.
This content is provided for educational and informational purposes only and does not constitute investment advice, financial recommendations, or a solicitation to buy or sell any security or futures contract.
Always conduct your own due diligence and consult with qualified professionals before acting on any information contained herein.